
Spectroscopy: From the Stars to the Eyes
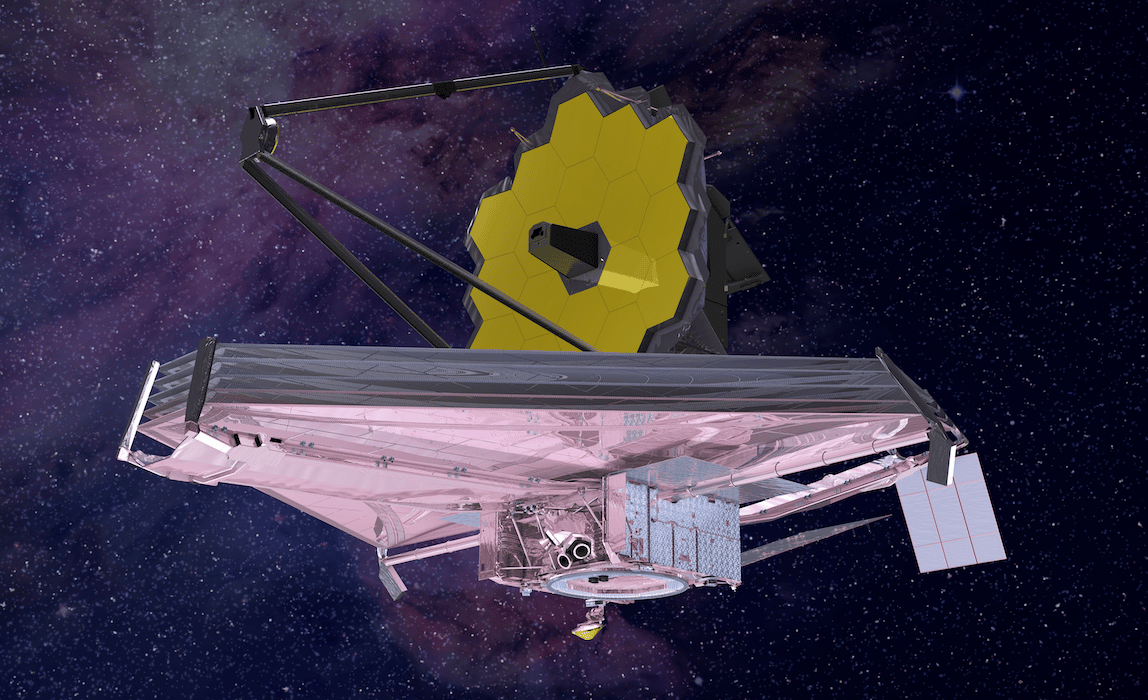
The James Webb Space Telescope is the result of an international collaborative effort to solve mysteries in our solar system using the power of spectroscopy.
Thanks to astrophysics, we know that space is expanding, and that the further away something is from any chosen point, the faster it expands. Most non-scientists know that the Speed of Light (SOL) is roughly 300,000 km/s or 186,000 miles/s. Many also know the Universe is approximately 13.8 billion years old.
Given an arbitrary starting point, the visible universe should be an expanding globe, now (logically) 27.6 billion light-years across. Yet in actuality, it is 93.016 billion light years across (and growing). Space itself is expanding and that is why we use the words visible universe to describe what we see.
At the greatest distance, space is expanding so rapidly (compared to where we are right now) that it exceeds the speed of light, so photons emitted will never have enough speed to reach us. Those galaxies at the furthest reaches disappear forever, even though to them space is normal around them and our galaxy is the one that just disappeared, receding faster than SOL.
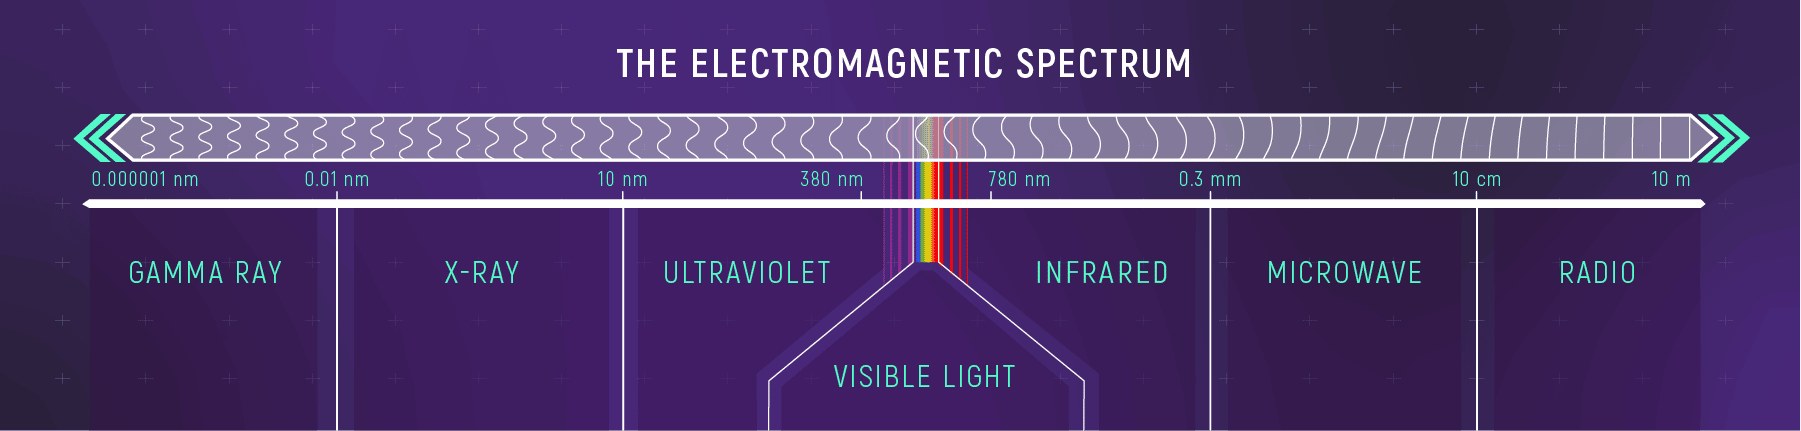
With that in mind, light from that ultimate visible distance is so stretched out that normally invisible ultraviolet has been elongated through expanding space until it has passed right through the visible light part of the spectrum. Light is now arriving here in the other invisible wavelength, the infrared band. We call this effect red-shifting.
Credits: NASA, ESA, Leah Hustak (STScI)
James Webb Space Telescope
The James Webb Space Telescope (JWST) is an international collaboration between NASA, the European Space Agency, and the Canadian Space Agency. Many collaborators from various countries contributed to the design and launch of the most powerful telescope ever built.
The JWST was developed to look at these near and mid-infrared light waves in order to let us see the most distant objects in the visible universe. Visible light is easily disrupted, absorbed, interfered with, and just generally contaminated by all sorts of interstellar or intergalactic phenomena. Infrared, being a much longer wavelength, can penetrate these obstacles.
Lower frequencies travel better, much like the sailor coming home from the docks in the dark hears this strange, low pulsing sound. As he gets closer to home, higher and higher frequencies are heard until he finally recognizes the piano being played by his daughter…
Once obtained, we can adjust the light frequencies back to where they were originally on the spectrum so we can make visible-light images. Some of the most interesting parts are in the Near Infrared (NIR) of the electromagnetic spectrum (from about 700 to 2500 nanometers) but the oldest images will come from the longer waves of the more-penetrating mid-infrared. The JWST has done nothing but surprise us with every image. The detail is astounding; the darkest, tiniest spot in the sky has thousands of galaxies in it; at the edge of our perception, we think we may have found the oldest galaxies ever seen at z-20 (a red-shift measurement) placing them about 180 million years from the Big Bang, the closest we’ve gotten to the beginning of the universe as we know it.

Credits: NASA, ESA, CSA, and STScI
Spectroscopy
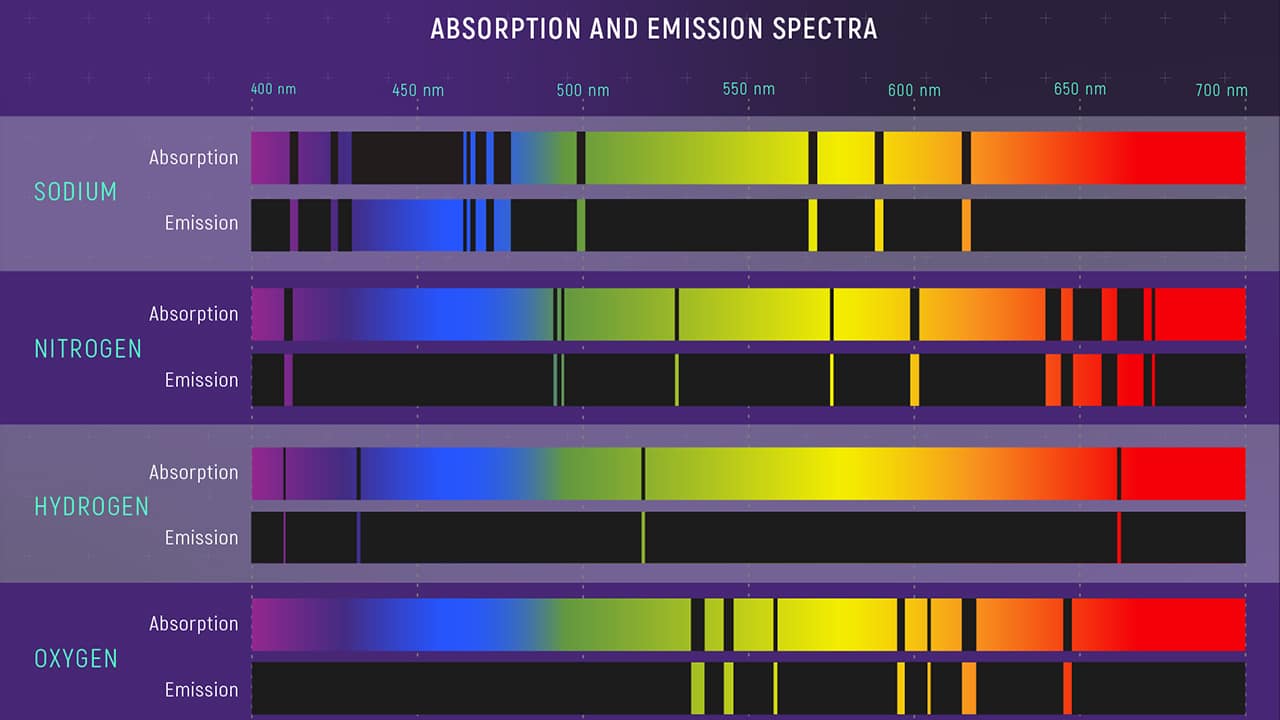
The prowess of the TSJW is based on spectroscopy which is the study of the spectra of electromagnetic radiation emitted or absorbed by a substance (The Canadian Encyclopedia).
One of the particularities of this tool is that it can tell us which light is “missing”. As that ancient light passes through dust and gas clouds on its way to us, some frequencies will be absorbed. The top image shows which light has been absorbed from a spectrum; the lower part shows the light emitted by that same substance. That missing portion tells us what gases or materials were in the path that absorbed that light.

The telltale shifting of those identifying lines gives us additional useful information. Nearly all galaxies are moving away from us, and so their distinctive pattern of lines shifts towards the red end of the spectrum as the light gets stretched out by the expansion of space described earlier.
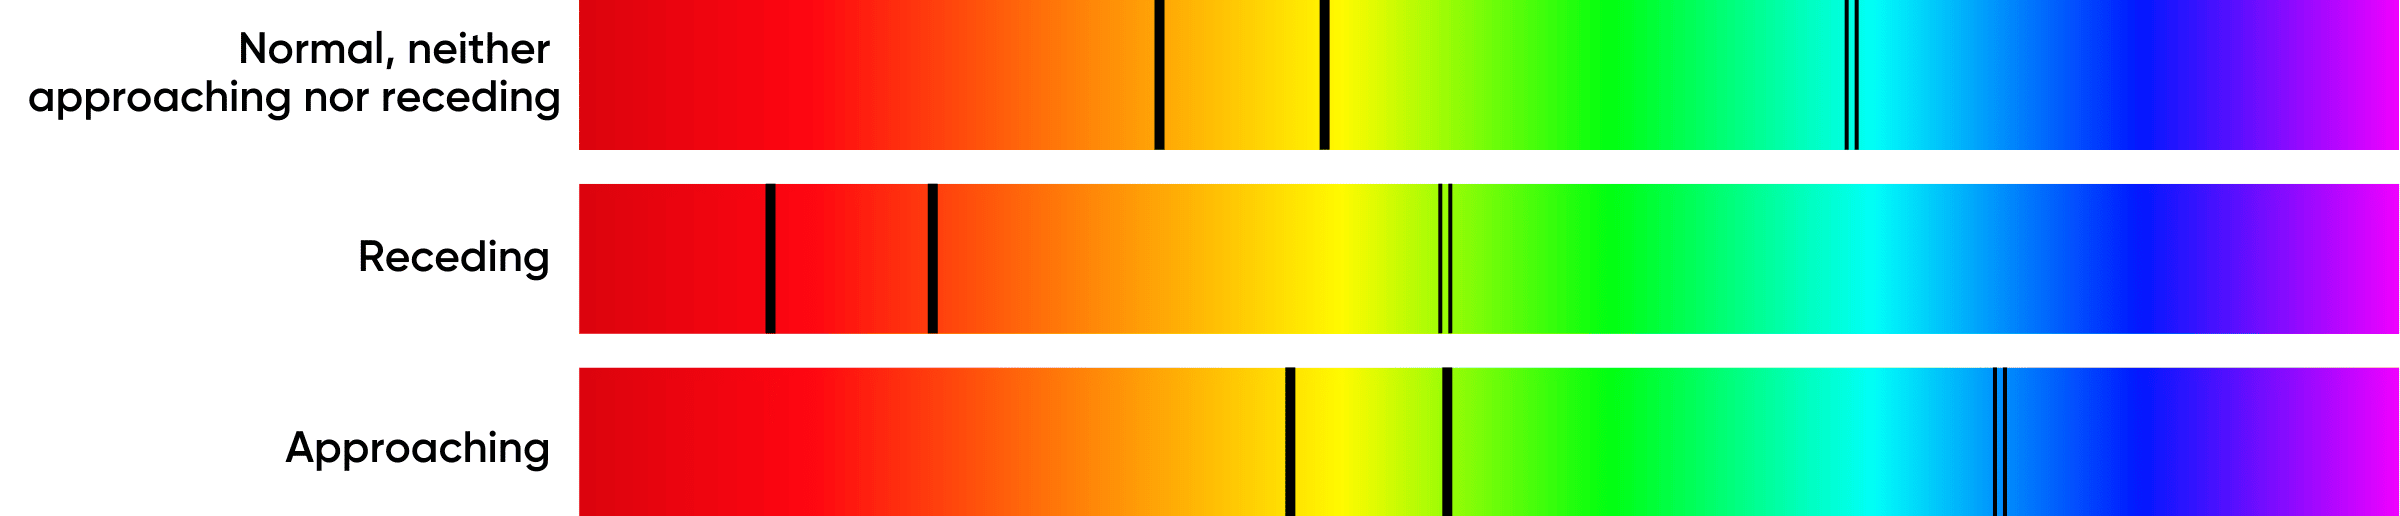
In some rare cases, as in our local group of galaxies, we are gravitationally bound and the galaxies are approaching each other. This causes the light to shift towards the blue end of the spectrum as the light waves are compressed, hence the name blue shift.
By looking at how much the light is red-shifted, we can determine how far the light has traveled to reach us. As mentioned earlier, the most distant galaxies’ UV light has been so stretched by its travels that its frequency is now down in the infrared band. JWST was designed to see and record that light so we can shift it back in the color spectrum to see it as it was originally.
In this simple illustration, an unknown sample is heated up until it begins to radiate light. We pass the resultant light through a prism to create its spectrum. We can then see that there are just two metals present. The emission lines are always the same distance apart so we can identify that the sample contains just these two metals by direct comparison with known metal signatures.
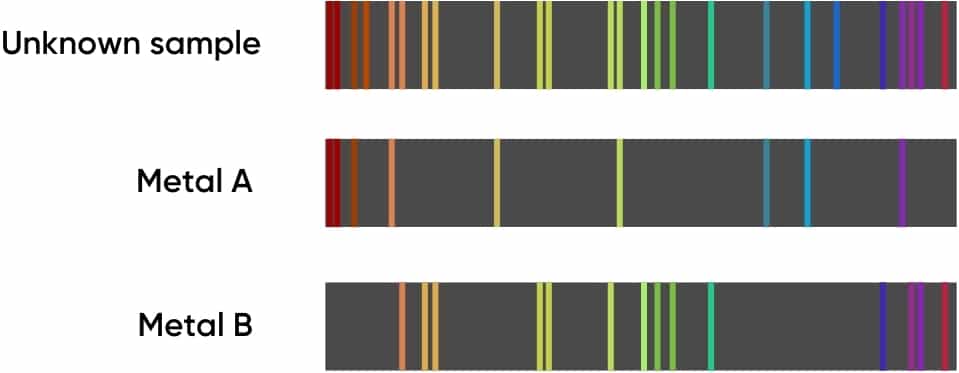
When applied to stars’ emission lines we can get a unique signature for each star, telling us the constituents of that star and, by the intensity of the lines, how much of each material is present. Essentially, it is the star’s fingerprint.
Credits: NASA, ESA, Leah Hustak (STScI)
Spectroscopy Applied to Health
Much closer to us, spectroscopy has multiple applications in medicine and can save lives on a daily basis. In oncology, it has the capability to provide morphological and biochemical features of normal and cancerous tissue. In cardiology, it can identify superficial foam cells in coronary plaques. In pneumology, it helps differentiate between normal and malignant lesions in terms of tissue blood properties.
More recently, research efforts in medicine are shifting to the eye as a source of key information about many health conditions. Indeed, the eyes are the only organs in the human body where the central nervous system and blood vasculature are visible. The eye’s transparent media allows for visualization of the retina in vivo using non-invasive tools such as spectroscopy.
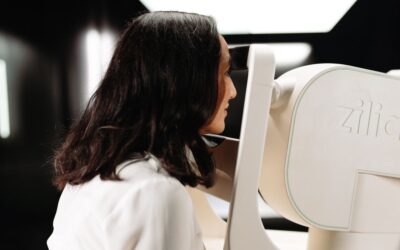
For instance, Zilia has recently developed Zilia Ocular, a unique retinal camera that uses Diffuse Reflectance Spectroscopy (DRS). The device works by emitting low intensity light that travels through the transparent media of the eye, reflects off the back of the eye before being analyzed to extract absorption spectra of biomarkers such as oxygen saturation (i.e. oximetry).
The goal of measuring oxygen diffusion in ocular tissues is to help better understand and identify ocular diseases before permanent damage occurs. Measuring oxygenation could also help prescribe more targeted therapies and develop new drugs. This new method has great potential as a diagnostic and management tool.
The eye’s transparent media allows for visualization of the retina in vivo using non-invasive tools such as spectroscopy.
Conclusion
Just as with the study of stars and galaxies, we can derive a tremendous amount of valuable information from the analysis of light from the back of the eye. And since the eye is a window to the health of the body, we can measure health markers related to a host of ocular, neurological, cardiac, and other conditions. Spectroscopy is basically a new way to shed light on many old problems. We are at the beginning of ocular exploration and Zilia will be at the forefront of these discoveries.
Credits
Images and illustrations are adapted from https://webbtelescope.org/resource-gallery
Written by the Zilia Team on November 14, 2022
More on our Blog
Zilia Ocular to Support Study in AMD and DME
Quebec City, March 9, 2026 – Zilia announced today that its Zilia Ocular device will be used in a new...
Canadian Study on Retinal Oxygenation Using Zilia Ocular
Quebec City, February 20, 2026 – Zilia announced today that its Zilia Ocular device will be used in a new...
Zilia to Support Landmark Study on Retinal Degeneration and Regeneration
Quebec City, November 26, 2025 – Zilia, a health technology company at the forefront of oculomics, announced...

Solutions